
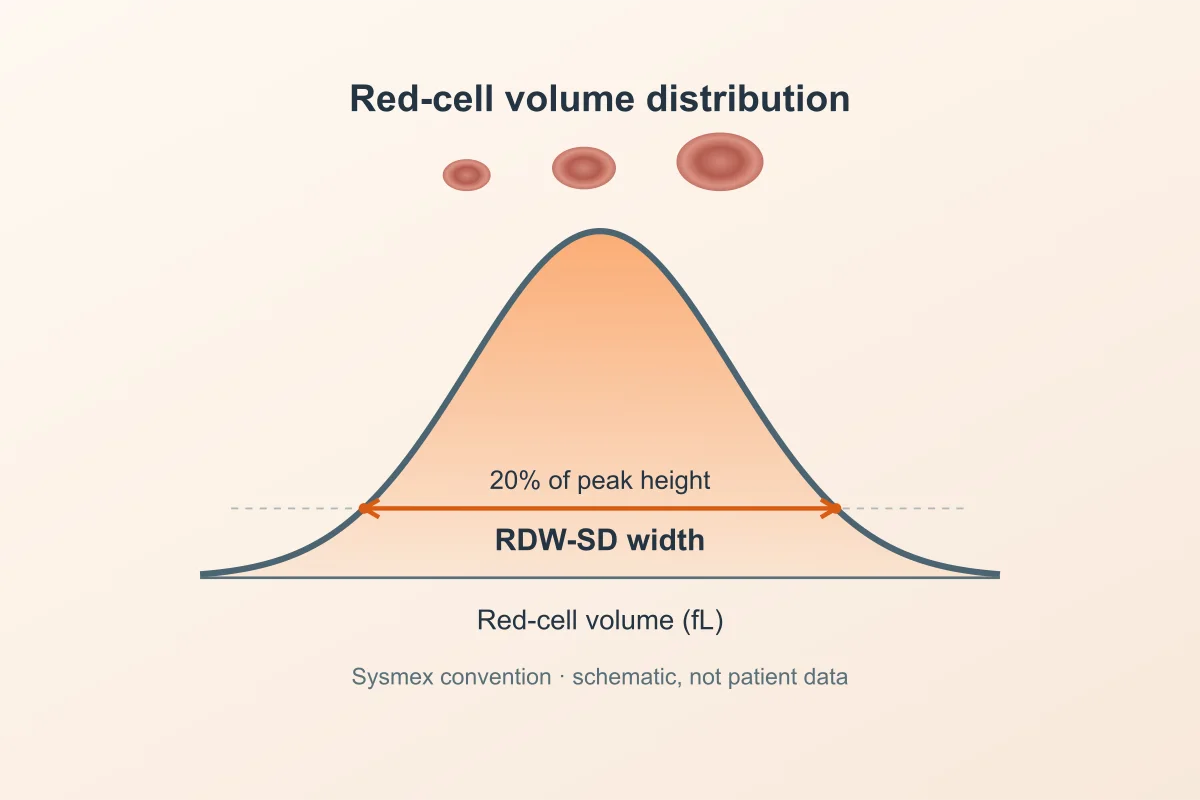
What the analyser is measuring
A red-cell histogram shows how many measured cells fall at different volumes. Sysmex describes RDW-SD as a width measured across this distribution at 20% of the histogram’s height above the baseline. A broader distribution gives a greater width. That 20% is a measurement height on the graph, not the percentage of abnormal cells.See reference 2
The original diagram illustrates that measurement convention without showing patient data, a reference range or a diagnostic cut-off. Instrument definitions and processing matter, so use the method and interval supplied by the laboratory rather than treating the drawing as a calculator for a report.See reference 1,See reference 2
Three blood-count lines that answer different questions
- Line and unit
- RDW-SD, fL
- Question it answers
- How broad is the distribution under this analyser’s definition?
- Why it is not interchangeable
- A volume-based spread measurement, not a percentage.See reference 1,See reference 2
- Line and unit
- RDW-CV, %
- Question it answers
- How large is the statistical spread relative to the average cell volume?
- Why it is not interchangeable
- Its definition uses a statistical spread relative to the average; it is not a universal conversion from the reported SD line.See reference 1,See reference 2
- Line and unit
- MCV, fL
- Question it answers
- What is the average red-cell volume?
- Why it is not interchangeable
- An average and a measure of spread can share a unit while measuring different things.See reference 1,See reference 4
Why a simple conversion does not reconstruct RDW-SD
The letters SD do not establish one interchangeable calculation across instruments. The methods cited here use different descriptions: Sysmex specifies a histogram width at 20% height, while Beckman describes its parameter as distribution spread from the histogram, expressed as a standard deviation in fL. Do not assume an identical calculation from the shared label.See reference 1,See reference 2
A coefficient-of-variation formula does not, by itself, reconstruct Sysmex’s 20%-height width. Follow the exact instrument definition if a laboratory needs to relate parameters. MCV and RDW-SD can both use fL while describing an average and a spread, so their reference intervals are not interchangeable.See reference 1,See reference 2,See reference 4
What a high or low flag means
A high RDW-SD flag means that the reported measure of spread is above that laboratory’s interval for that measurement. It does not identify the cause. Red-cell size variation can occur in different blood-count patterns, and an RDW result alone cannot confirm iron deficiency or select an iron supplement.See reference 1,See reference 3,See reference 5
A narrow distribution is not proof that every red cell is the expected size: a group of similarly small cells could have a low average volume without a wide spread. Read the SD line with MCV, haemoglobin, the rest of the CBC and any laboratory comments. A normal spread can occur with anaemia.See reference 3,See reference 4,See reference 5
Make comparisons between like results
Retain the exact label, fL unit, laboratory interval and date. When comparing reports from different laboratories, ask whether the same RDW measurement and analyser method were used. If a report gives only “RDW” without a clear unit, clarify the label before comparing it with an older SD result.See reference 1,See reference 2,See reference 3
Common questions
Is RDW-SD the percentage of abnormal red cells?
No. It describes the spread of cell volumes in femtolitres. A percentage result labelled RDW-CV is a different index and also does not count abnormal cells.See reference 1,See reference 2
Can a normal RDW-SD exclude anaemia?
No. Anaemia and its causes are assessed from haemoglobin, the overall blood-count pattern and other clinical information, alongside any result that describes spread.See reference 3,See reference 4,See reference 5
Should I try to lower RDW-SD for longevity?
The cited analyser and blood-count sources do not establish a target that extends life. An unexplained or persistent flag is a question for clinical interpretation, not a stand-alone optimisation goal.See reference 1,See reference 2,See reference 5
Get the weekly longevity brief
The week's best longevity research in plain English. Free, every Tuesday.
See your blood results in context
If you already have blood test results, the paid LongevityMate app can help you view related markers together. It provides educational context, not a diagnosis or a replacement for your clinician.
Explore blood test analysisReferences
- 1. DxH 900/DxH 690T Instructions for Use: parameter derivation
Beckman CoulterOfficial guidance
- 2. XN-Series measurement technologies, XTRA 1/2019: RDW-SD and RDW-CV (German)
Sysmex EuropeOfficial guidance
- 3. RDW (Red Cell Distribution Width)
MedlinePlus, U.S. National Library of MedicineOfficial guidance
- 4. MCV (Mean Corpuscular Volume)
MedlinePlus, U.S. National Library of MedicineOfficial guidance
- 5. Complete Blood Count (CBC)
MedlinePlus, U.S. National Library of MedicineOfficial guidance
Editorial transparency
- Published by
- LongevityMate Editorial
- Reviewed by
- Editorial evidence review (AI-assisted)
- Published
- Updated
Medical disclaimer
General education only. This guide does not diagnose a condition, interpret your personal result, choose a treatment or recommend a supplement dose. A qualified health professional can interpret the full report in context.